When exascale computers begin calculating at a billion, billion operations each second, gaining insights from the massive datasets generated by the simulations they run will be a huge challenge. Scientists may be tempted to pause the simulation, effectively “holding the machine hostage” as they scramble to create meaningful portrayals of the data barrage, says Hank Childs, a Lawrence Berkeley National Laboratory computer systems engineer. Childs, a recent recipient of a $2.5 million Department of Energy Early Career Research Program award, is out to prevent that.
Hank Childs
A former chief software architect for a component of DOE’s Visualization and Analytics Center for Enabling Technologies, Childs backs the idea that running simulations in lieu of doing experiments is the most cost-effective way to advance scientific knowledge in the era of mega-performing machines.
“My piece of the puzzle is helping people know what the simulation is telling them,” he says. “Scientific visualization is taking the data and then producing images that let people see the data. Ideally, this will lead to new science, the new insights, that realize the simulation’s value.”
But he and fellow visualization researchers fear looming logjams, in both input/output and data movement, as supercomputing advances in about five years from the current petascale level of a million billion floating point operations a second (flops) to the exaflops range.
“If somebody hands you a petabyte or, in the future, an exabyte, how do you load that much data from disk, apply an algorithm to it and produce a result?” Childs asks. “The second challenge is complexity. You only have about a million pixels on the screen – not many more than in your eye – so you have to do a million-to-one reduction of which data points make it onto the screen.”
Such pare-downs raise questions about the remaining data’s integrity, Childs says. “And even if this data integrity issue is managed, we may still produce images so complex that they overwhelm what our human visual processing system can understand. So we’re not doing anything meaningful.”
Exascale computing will pose even more special challenges than that, although operators would seemingly be in a better-than-ever driver’s seat. “One bottleneck will have to do with data movement between (processor) nodes and even from primary memory to cache to registers. And it will be a real problem if we have to store it or read it back. All that data movement will take too much time. Secondly, it will take power – the central issue at the exascale.”
Childs cites Argonne National Laboratory’s Mira, an IBM Blue Gene/Q system that uses about 4 megawatts of electricity to calculate at a little more than 10 petaflops. That’s much more efficient than many earlier computers but still energy-hungry when taken to exascale. Most experts believe 20 megawatts is the limit for computer power consumption, Childs says. So an exascale version of Mira would be 100 times faster but could fuel that speed with only five times more power.
“In every part of the simulation process, people will be asking ‘How can we do this in a power-efficient way?’ And visualization and analysis is no exception. We also have to rethink how we will do things. For us, it really comes down to minimizing data movement, because that costs power.”
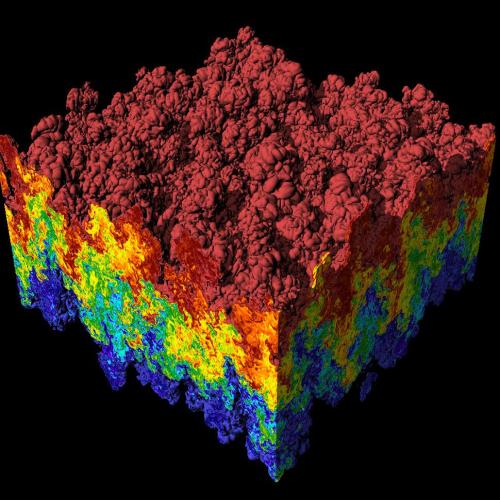
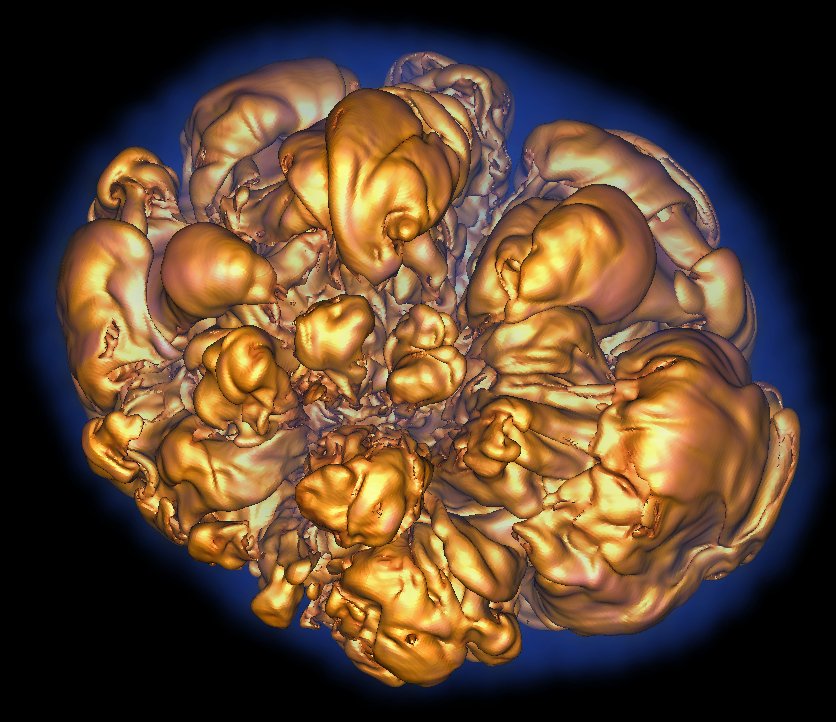
Visualization by Hank Childs of a Rayleigh-Taylor instability, in which heavy and light fluids mix. Andrew Cook, Bill Cabot and Paul Miller performed the simulation using the MIRANDA code on LLNL’s IBM Blue Gene/L computer.
In visualization, that will mean abandoning the traditional, time-consuming practice of regularly storing simulation snapshots – at full resolution – on disk, then later reading them back on separate resources to apply visualization algorithms and create images that help interpret data.
Though he’s only starting his five-year research program, Childs expects his “Data Exploration at the Exascale” Early Career project will focus on creating techniques that avoid regularly saving the full simulation for visualization and analysis. Running at exascale will make his task more complicated: Like the simulation itself, data-processing will have to be executed in a billion-way concurrent environment while minimizing information flow to trim power costs.
To do that, visualization and analysis researchers have seized on in situ processing: running visualization and analysis routines concurrent with the simulation and operating directly on the data. In situ visualization eliminates the need to record simulation data but works best when application scientists know at the start what they want to study. Without that, their only choices are to pause the simulation and explore the data or accept that the data will be lost forever.
Childs’ approach is to reduce the data using in situ techniques and then record it. “Of course, how to reduce the data while keeping the portions scientists want to study and also maintaining the data’s integrity is a significant challenge.”
Childs’ project summary uses a cookbook analogy: “When a cook wants to produce a specific dessert he consults his cookbook and learns what steps and ingredients are necessary and how long it takes to bake.”
To which he adds, “I’m hoping to create a cookbook for application scientists to say ‘I’m interested in doing this sort of analysis and have these data, and I know this will be the right technique to meet my power, data and integrity costs.’”
Childs, who turned 36 this summer, first wanted to be a high school math teacher. Early in his undergraduate years at the University of California, Davis, he bowed to a request from his father, a Ph.D. in electrical engineering, to “take one programming course,” Childs recalls. “My dad was right. I found I was really good at it. So instead I became a computer scientist.”
After graduating in 1999, the super-organized Childs went shopping for a job and a Ph.D. program and found both in visualization, choosing to study at Davis and considering three positions at Livermore. He took the one in visualization because “I just thought I would work well with the guy who would be my boss.”
At Livermore, where Childs remained until moving to Berkeley Lab in 2009, he worked on designing visualization software that could work directly on large dataset computers. He became the main architect of what he and his colleagues named VisIt. Childs’ Ph.D. thesis was on a related subject: “An Analysis Framework Addressing the Scale and Legibility of Large Scientific Data Sets.” Fortuitously, both coincided with the dawn of exploding interest in high-performance computing.
“How amazing for me,” he says. “I went and got a job just because I wanted to get a Ph.D., and I stumbled into an amazing situation at the forefront of HPC at the intersection of HPC and vis.”